The Client was a manufacturing company of Small materials related to IT, which were produced and sold in outside markets. They had provided a raw file of their products, which had sales data, production, their costing and other raw data.
They needed me to –
1. Clean the files and redo the data presented in professional meaningful format.
2. Create Annual Detailed cashflows for last 3 yrs and a forecast for the next year.
3. They also had a couple of analysis to be performed related to their business strategy, which has been modelled in different tabs, this was one of the biggest challenges as there was a lot of data to be handled.
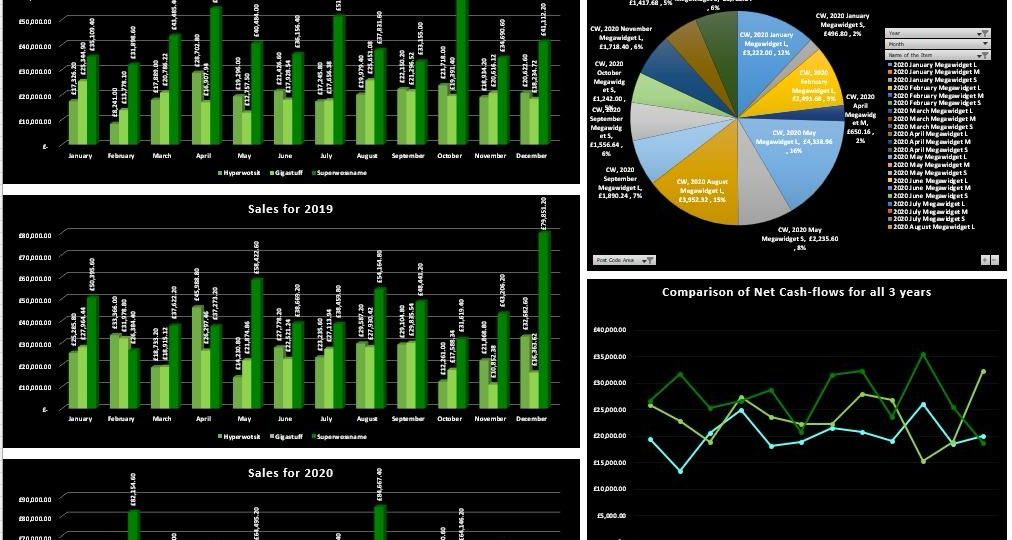
4. Separate pivot chart was prepared to represent their sales regionwise and product wise.
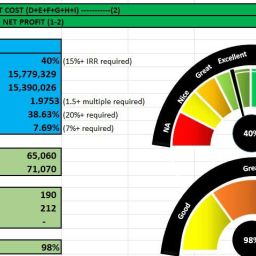
5. The main page provides a one-pager dashboard to summarise all the findings in some beautiful pie charts and Bar-graphs/Line graphs.
6. Macro Buttons have been added for easy navigation on the dashboard
PDF file has been uploaded to show the extent of work done and data has been replaced with dummy data in order to protect client’s privacy.